Home | Publications | Lighthouse study
Relative background noise in the 5-10 kHz band
The primary contributors to 5-10 kHz noise in this study were surf and wind. Traffic noise was very light at most stations and not considered to be a significant noise factor because even the third harmonic of car transit sound barely creeps into the 5-10 kHz range. To assess whether background noise might be a factor when comparing call totals among stations, norms were established during periods with no significant sound from wind or surf. A calm weather period facilitate this from the night of May 3-4 through May 10-11, excluding May 7-8, which had minor surf noise at two of the coastal stations. A second calm period from May 18-23 was also utilized.
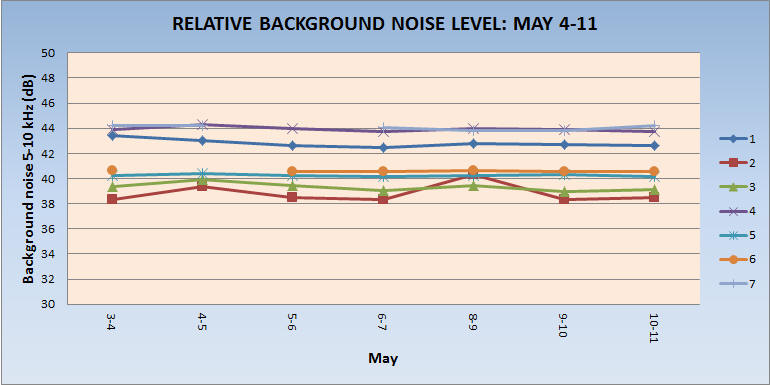
Figure 10a shows the consistency of background noise during the first calm period. The different levels of background noise indicated between stations reflect inherent system gain differences between the stations. In other words, the equipment recording levels were not the same but varied by 0-6dB. This does not affect call detection because the Old Bird call extraction software detects signals relative to average background noise. Therefore, if the recording level is increased, background and bird calls will be equally increased in loudness and the Old Bird detector would recognize the same relative loudness difference.
Fig. 10b shows background noise level results from the second calm weather period later in the month of May. This data shows a ~1dB lower recording level at Station 6 than in Fig. 10a - this change was associated with the new microphone installed on May 19-20 that replaced a damaged one. Fig. 10b also shows a ~3 dB higher recording level at Station 4 than in Fig. 10a - this change was associated with the higher recording level of a new laptop computer installed on May 13-14 that replaced a defective one. Fig. 10b shows no data for Station 7 because that station had an irregularly lower recording level due to a microphone problem. Stations 1-3 & 5 all show similar recording levels during the first and second calm periods.
Fig. 10c shows the intra-station standard deviation among the nights in each quiet period. Table 2 shows the discrepancy from each station's quietest night for all night during the study period. It also shows standard deviation between such discrepancies for all the stations operating on a night.
Fig. 10a. Relative background noise level for the first quiet period in the study, May 4-11. May 7-8 is excluded as some coastal stations had surf noise. Data is for seven nights except Station 6 & 7, which show six nights.
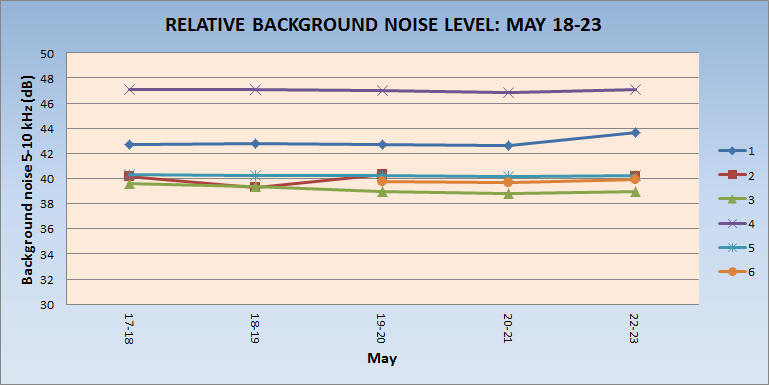
Fig. 10b. Relative background noise level for the second quiet period in the study, May 18-23. The data is for five nights except Station 6 & 7, which show three & four nights respectively.
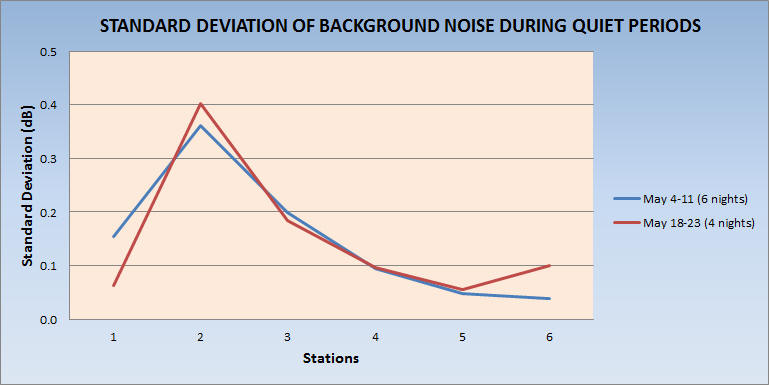
Fig. 10c. Comparison of the intra-station standard deviation between nightly average background levels for the two quiet periods in the study. The SD for Station 6 in the second quiet period only compared three nights.
Table 2. Indicates the discrepancy of a night's average background noise level from the station's quietest night (blue numbers). Data from Station 7 after May 11-12 was compomised by a damaged microphone. The initial equipment configuration for Station 4 had a 43.74 dB quietest night. An equipment change on May 11-12 led to an inherently higher recording level, which had a quietest night of 46.74 (measured during 2nd quiet period). A microphone change at Station 6 on May 19-20 led to an ~1 dB quieter recording level (i.e., 39.66 quietest night in 2nd quiet period) from that night onward. Light orange cells indicate a night when the background level was 3 dB to 6 dB louder than the station's quietest night. Darker orange-shaded cells indicate a night when background level was 6 dB or louder than the station's quietest night. Light blue cells indicate nights when an average background level equalled that sstation's quietest night of the study period. The SD column shows the standard deviation of the background noise discrepancy for the stations that operated that night with the number of nights figured in parentheses. Note that four of the six stations that operated on May 11-12 equalled their quietest night, but that May 9-10 had the lowest standard deviation between stations.
| Background noise (dB) relative to quietest night (blue) at Stations 1-7 | ||||||||
| 1 | 2 | 3 | 4 | 5 | 6 | 7 | SD (nights) | |
| May | 42.50 | 38.27 | 38.80 | 43.74 | 40.14 | 40.4 | 42.80 | |
| 3-4 | 0.90 | 0.57 | 1.10 | 0.16 | 0.13 | 0.24 | 0.40 | 0.349 (7) |
| 4-5 | 0.50 | 1.07 | 1.67 | 0.59 | 0.27 | ND | 0.38 | 0.484 (7) |
| 5-6 | 0.16 | 0.22 | 1.17 | 0.23 | 0.09 | 0.19 | 0.90 | 0.398 (7) |
| 6-7 | 0.00 | 0.07 | 0.76 | 0.00 | 0.02 | 0.18 | 0.23 | 0.252 (7) |
| 7-8 | 0.83 | 7.28 | 3.79 | 0.50 | 0.27 | rain | 1.01 | 2.522 (6) |
| 8-9 | 0.31 | 2.03 | 1.20 | 0.23 | 0.10 | 0.21 | 0.03 | 0.692 (7) |
| 9-10 | 0.20 | 0.06 | 0.70 | 0.15 | 0.15 | 0.14 | 0.00 | 0.214 (7) |
| 10-11 | 0.16 | 0.20 | 0.87 | 0.00 | 0.03 | 0.13 | 0.38 | 0.278 (7) |
| 11-12 | 0.16 | 0.00 | 0.64 | 0.00 | 0.00 | 0.00 | 0.235 (6) | |
| 12-13 | ND | ND | ND | ND | ND | ND | ND | |
| 13-14 | 3.29 | 8.32 | 1.27 | 3.90 | 0.46 | 1.90 | 2.568 (6) | |
| 14-15 | 20.43 | 24.22 | 16.89 | 11.36 | 1.76 | ND | 7.829 (5) | |
| 15-16 | 18.14 | 23.12 | 16.24 | 9.76 | 0.73 | ND | 7.727 (5) | |
| 16-17 | 0.40 | 6.17 | 1.76 | 1.60 | 0.76 | ND | 2.080 (5) | |
| 17-18 | 0.24 | 1.89 | 1.33 | 0.36 | 0.16 | ND | 0.689 (5) | |
| 18-19 | 0.26 | 1.02 | 1.06 | 0.35 | 0.13 | ND | 0.394 (5) | |
| 19-20 | 0.23 | 2.04 | 0.70 | 0.29 | 0.07 | 0.13 | 0.687 (6) | |
| 20-21 | 0.10 | ND | 0.56 | 0.10 | 0.00 | 0.00 | 0.208 (6) | |
| 21-22 | 1.19 | 4.13 | 1.04 | 4.02 | 0.12 | 0.35 | 1.644 (6) | |
| 22-23 | 0.40 | 1.86 | 0.72 | 0.35 | 0.12 | 0.24 | 0.586 (6) | |
| 23-24 | 0.96 | 3.10 | 1.19 | 2.76 | 0.17 | 0.50 | 1.102 (6) | |
| 24-25 | 8.83 | 17.03 | 4.40 | 6.53 | 0.45 | 2.67 | 5.353 (6) | |
| 25-26 | 1.29 | 6.89 | 1.72 | 1.86 | 0.47 | 1.20 | 2.126 (6) | |
| 26-27 | 5.66 | 11.76 | 4.39 | 3.80 | 0.72 | 1.77 | 3.561 (6) | |
| 27-28 | 8.54 | 10.62 | 5.83 | 6.19 | 1.02 | 1.04 | 3.559 (6) | |
| 28-29 | 2.60 | 3.07 | 2.76 | 0.97 | 0.32 | 0.88 | 1.073 (6) | |