For certain similar species we have included spectrographic descriptions which are intended to summarize the basic characteristics of a species' flight call that are visible or measurable in a spectrogram. These characteristics include the length (measured in mS) and the frequency range (measured in kHz). We also provide a physical description of the basic frequency track (i.e., if the species' flight call is typically rising, descending, wavering, etc.). If the call is modulated, we measure what we call the spacing and depth of modulations (see Fig.1. below). The spacing is the duration of one modulation cycle, or as we say, the distance between modulation peaks or humps. The depth is the height or frequency range of the modulation peaks or humps.
To make these descriptions, we measured spectrograms of flight calls from as many individuals of a species as we had available (the number of individuals measured is noted at the beginning of the description). However, for many species our sample size is small and the measurements merely serve as baseline data for comparison. Most measurements include the range (given first) and the average (given in parentheses) from our sample. Note that in cases where the modulation spacing or depth was uneven, we took a rough average measurement. Also, in the case of double-banded calls, while the frequency range was measured considering both bands, modulation depth was measured from only the lower band.
Fig.1 illustrates how we measured characteristics of spectrograms. To measure modulation rate we manually positioned time measurement lines in the middle of modulation peaks, noted the time between the lines, then divided by the number of modulations spanned. In Fig.2 the time between the two modulation humps is 57.1-28.0 = 29.1 mS. The modulation rate would be 29.1 divided by two modulation cycles or 14.5 mS. The high frequency (or low frequency) of a call was measured by manually positioning a frequency measurement line through the middle of the sound's time-frequency contour line at the highest point of the call. Fig.1 illustrates the measurement line running though the middle of the spectrogram smear composing the top of the first modulation peak. A high frequency of 8.25 kHz is indicated. Low frequency was measured similarly.
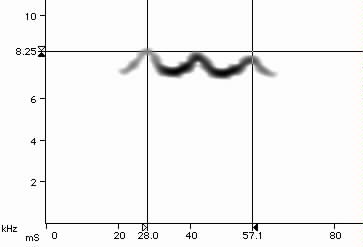
Fig.1.
Duration of calls was measured by positioning measurement lines at the ends of a call. It should be noted that the call duration measurements in this guide are less accurate than those of frequency and modulation rate. The call duration is dependent on the call being recorded well enough so that weak detail at the beginning and end of the call is portrayed. This was not always the case. However, if one is using our measurements to compare with their own field recordings, this may not matter as it is likely that other field recordings will have the same problem. Furthermore, such error appears small considering the wide range of variation in the call duration for most species.