In some spectrograms, distinctive bands of background insect noise, other bird calls, and various low frequency noise are evident and are noted in the descriptive text under the spectrogram (e.g., Fig.1). We generally only point these features in a spectrogram out if we feel it is helpful for interpretation.
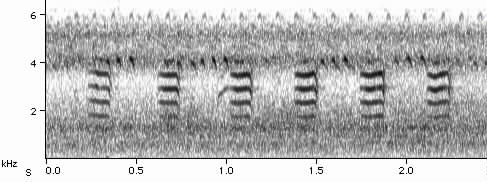
Fig.1. New Jersey October 3, 2001 (WRE).
Red-breasted Nuthatch calls with insect song at 4 kHz and 6 kHz.
Some spectrograms reveal sound that has reflected off of nearby vegetation. This gives a smudged appearance to the right of the primary sound representation of the bird call. We note this in extreme cases to help the viewer decipher what they are seeing in the spectrogram (e.g., Fig.2). Such "muddied" examples were only used in the guide when our sample size was small and we lacked better examples.
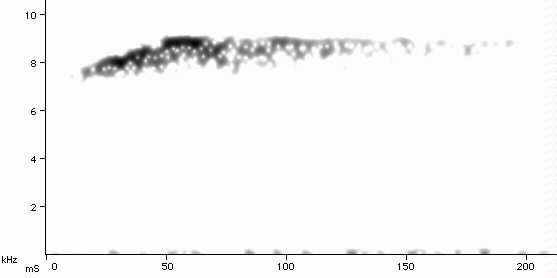
Fig.2. Virginia July 19, 1995 (MO).
Swainson's Warbler flight call. Note strong vegetation reflection.
Many spectrograms appear to have two or more separate sounds (often referred to as "bands"). There are a several clear causes of this phenomenon and others that are more difficult to pinpoint. Some spectrograms show a fundamental frequency (first harmonic) and the second harmonic an octave higher or, in other words, at double the fundamental frequency. Figure 3 shows what appears to be a fundamental tone and a lower harmonic at half the fundamental's frequency.
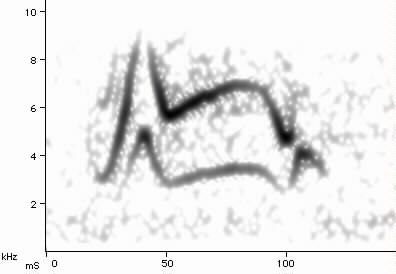
Fig.3. Texas December 19, 2001 (WRE).
Sprague's Pipit flight call from bird in flight.
Other spectrograms show overtones that are not harmonically related (e.g., Fig.4.). Note that in Fig.4 the two bands are not a full octave apart.
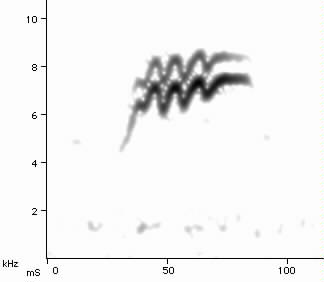
Fig.4. Florida May 13, 1993 (WRE).
Presumed Common Yellowthroat nocturnal flight call.
Greenewalt (1968) discusses a variety of mechanisms for producing nonharmonic overtones. However, in most cases in this guide, we believe that the nonharmonic overtones are produced by the bird's vocal mechanism. Figs. 5 & 6 show examples of a birds ability to vary one of the tones independently of the other.
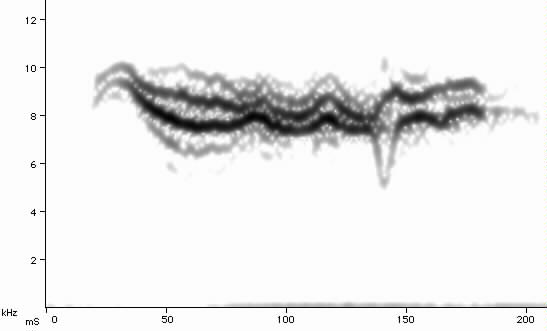
Fig.5. New Jersey November 17, 1997 (MO).
White-throated Sparrow diurnal flight call.
Fig.6. Minnesota October 26, 2001 (WRE).
Presumed Song Sparrow nocturnal flight call.
In most cases, such syrinx-created overtones in warbler and sparrow flight calls tend to mirror one another closely and variations such as in Fig.5 & 6 are uncommon. We have documented that many species seem to be able to give a single-toned (single-banded) or two-toned (double-banded) version of their flight call, and that some species tend one way or the other. Some species can vary the frequency of each tone, though again, each species tends to have its own characteristic frequency of separation between the tones (bands). For most, the intensity appears to be loudest in the lower tone. However, due to the fact that high frequencies attenuate in the atmosphere more than low ones, this variation in loudness may be due to different attenuation rates of the tones. In some species such as Nelson's Sharp-tailed Sparrow, the upper tone tends to be more intense (e.g., Fig.7).
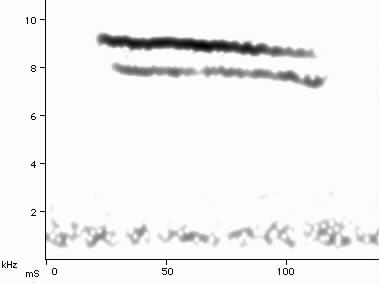
Fig.7. New Jersey October 19, 2001 (MO).
Nelson's Sharp-tailed Sparrow
The spectrograms in this guide offer an intriguing view into the complex and beautiful world of bird vocalizations. We encourage the reader to begin recording bird sounds and making spectrograms on their own.