The spectrograms in this reference guide are a scaffold for building a new level of listening acuity. When one first begins listening to flight calls, their ears may not be accustomed to discriminating short, high-pitched sounds. For example, flight calls of many species of migratory sparrows and warblers tend to get lumped into a catch-all category called "seep note". The bird sound hits the ear but the brain has no instructions for discrimination. The phenomenon is similar to how beginning birders deal with the visual identification of sparrows. At first, they all get lumped into the category called "little brown jobs". With continued field experience, combined with the use of pictures and behavioral descriptions in field guides, one develops the necessary attention to detail to quickly hone in on the specific characteristics that allow species identification of the sparrows. Similarly, by studying audio spectrograms, one can learn to hear subtle differences in short, high-pitched sounds that the ear is not normally trained to detect. By repeatedly playing back a sound while observing its spectrogram, one can work on hearing subtle qualities and variation in pitch and become more adept at identifying flight calls.
Simply speaking, an audio spectrogram is a visual representation of a sound - a graphical depiction of how the frequency of a sound or sounds varies with time. The essential elements of audio spectrograms in this guide are the sound's duration measured in milliseconds (mS), indicated on the horizontal axis, and its frequency or pitch measured in kilohertz (kHz), indicated on the vertical axis. Another element of the spectrogram is the varying intensity of a sound indicated by changing degrees in darkness. The overall pattern created is often complex but usually is comprised of one or more "bands" representing different tones.
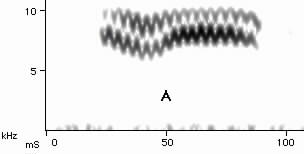
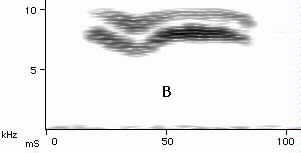
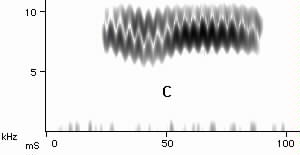
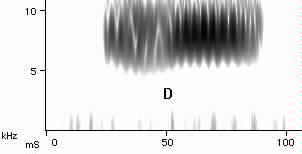
The frequency in a spectrogram is a measure of the rate of variation in sound pressure created when a bird vocalizes. A frequency of 2 kilohertz (kHz) in a spectrogram means that the rate of sound pressure variation was 2000 times per second. The tricky part in making spectrograms comes in portraying the frequency (or time characteristics) of the sound. This is because the accuracy in illustrating the frequency of a bird sound is limited by the interval of time over which the frequency content is analyzed. If the accuracy in depicting the frequency is increased, the accuracy in depicting time decreases. This uncertainty is graphically represented at any time in the spectrographic rendering of a bird call by a smear of dark points. The way this smear of dark points looks varies considerably depending on whether one is seeking to portray accuracy in frequency or accuracy in time. For example, the spectrograms of a Black-and-white Warbler flight call below were made with different time resolution parameters. This Black-and-white Warbler flight call has two independent modulated tones, one higher than the other. These tones have a fine modulation of around 250 cycles per second as seen in Spectrogram A. Spectrogram B was made with lesser time resolution than Spectrogram A and these parameters were not used in the guide for portraying this species' flight calls because these time parameters do not show the 250 cycles/sec modulation. Spectrogram C was made with a finer time resolution than Spectrogram A and though the 250 cycles/sec modulation is indicated, frequency resolution has begun to be lost and the spectrogram does not look as sharply delineated. Spectrogram D was made with even finer time resolution and the frequency information is now greatly compromised and leads to a spectrogram that is smudged beyond utility.
In this guide, our primary focus is to portray spectrograms so they show the overtones and variations in frequency that are audible to the human ear. To do this we needed to employ multiple parameters for making spectrograms. All spectrograms in this guide were made using the software called Canary, developed by the Cornell Bioacoustics Research Program www.birds.cornell.edu/brp Only certain fixed parameters were available with this software so the optimization of the time-frequency resolution was limited but sufficient for portraying the audible structures of the sounds. The parameters in Canary used on all spectrograms were a 512 FFT, 87.5% overlap, and Hanning window function. Variable parameters were the filter bandwidth and the time grid resolution. A filter bandwidth of 1367.79 Hz and a time grid resolution of .3638 mS (8 points) were used for calls like Black-and-white Warbler's which have fine modulations to resolve. A filter bandwidth of 683.89 Hz and a time grid resolution of .7256 mS were used for calls that have less fine modulations or pitch variations (e.g., Blackpoll Warbler). A filter bandwidth of 341.95 Hz and a time grid resolution of 1.451 mS were used for calls that did not have much modulation or sharp pitch variations (e.g., Swainson's Thrush). The latter two resolution parameters are the predominant ones used in this reference guide.
In addition to the time grid variable, different time scales were used for spectrogram display. For example, most spectrograms of the relatively short warbler and sparrow calls were created in Canary with a scaling of 30 mS per inch on the time axis and 3.0 kHz per inch on the frequency axis. Longer calls like those of the thrushes were made with a 60 mS per inch time axis scaling. Vocalizations such as Belted Kingfisher's rattle call were compressed even more. This was done to facilitate the display of the calls on computer screens. Therefore, when comparing spectrograms, make sure to check the time axis to see if the time scale is the same. The frequency scale is the same for all spectrograms in the guide's species pages.
Nearly all spectrograms in this reference guide are linked to corresponding audio examples. The audio track is longer than the sound represented in the spectrogram so that the listener has time to adjust to the background sound before the flight call occurs. In many audio tracks, though background sounds may be heard, they are not evident in the spectrograms. This is because the flight call is loud enough so that the spectrogram can be proportionately lightened to eliminate sign of relatively weak background sounds while still showing the intended flight call.